|
Click to listen to this article
|
By Ben Eborn, Publisher, North American Potato Market News
Growers have several things to consider when making planting decisions on 2025 potato acreage. Factors include contract volumes, current and projected prices, production costs, prices for alternative crops, crop rotations, trade disruptions and irrigation water supplies.
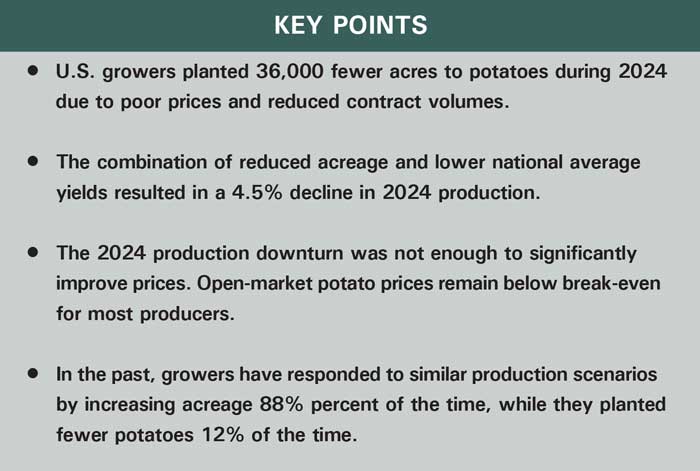
Growers also might want to consider past scenarios. Before this year’s estimated 4.5% year-over-year production downturn, U.S. potato production had declined by 5% or more 17 times during the 75 years since 1950. Fifteen of those 17 years were followed by an increase in the total U.S. planted area. The percentage increase ranged between 0.9% and 10.1%, with a median acreage increase of 4.8%. On the other hand, growers planted fewer acres to potatoes during the other two years. The percentage reduction ranged from 3.1% to 9.2%, with a median reduction of 6.2%.
Past years with similar production patterns may provide some insight into 2025 planting decisions. In this article, we review the situation that led to the 2024 production downturn. We also explore three historical scenarios that followed similar production downturns.
The Current Situation
In response to lower prices and contract volume reductions, U.S. growers planted 36,000 fewer acres of potatoes during 2024. Most of the reduction came in Idaho and Washington, where growers reduced the planted area by 15,000 acres and 5,000 acres, respectively. However, several other states also contributed to the downturn. California, Florida, Minnesota and North Dakota each planted approximately 3,000 fewer acres to potatoes in 2024. Michigan growers planted 2,000 acres less, while growers in Colorado, Nebraska and Wisconsin reduced their planted area by 1,000 acres. In Oregon and Texas, potato acreage was unchanged. Maine planted 1,000 more acres.
The 2024 production downturn followed a 9.5% production increase in 2023. That was the largest year-over-year production increase since 1994. In addition to the acreage reduction, the national average yield dropped to 454 cwt per acre from 458 cwt per acre in 2023. The acreage and yield combination resulted in a 420.2 million cwt potato crop (according to USDA’s January estimate), down 4.5% from 2023 production. It nearly matches the five-year average production. The large potato supply continues to put downward pressure on prices. The Grower Returns Index (GRI) for Idaho russets, so far this marketing year (as of press time), has averaged $6.98 per cwt.
A 0.9% Increase in 2014
U.S. potato production fell by 5.5% in 2013. That was 23.8 million cwt less than the 2012 crop. The Idaho GRI averaged $7.10 per cwt for the 2013-14 marketing year. In 2014, growers increased their planted area by 8,800 acres, or 0.9%, in response to profitable prices. The 2014 crop totaled 420.6 million cwt, up 12.5 million cwt, or 3.1%, from the previous year. The large increase was partially due to yield increases in nearly all the major growing areas (Idaho was the exception, with flat yields). At that time, it was the second largest potato crop since 2004, behind 2012.
The increase in production caused prices to plummet. The Idaho GRI averaged $5.47 per cwt during the 2014-15 marketing year, down 22.9% from the previous year. However, those prices were not low enough to discourage growers from planting more potatoes. In 2015, growers increased their planted area by 9,800 acres, or 1%. Production for the 2015 crop increased by 0.3% to 421.9 million cwt. The Idaho GRI rose slightly to $5.79 per cwt during the 2015-16 marketing year, a 5.9% increase.
A 7.4% Increase in 2011
U.S. production dropped by 6.8% in 2010 to 374 million cwt. That fell 27.4 million cwt below the 2009 crop. The Idaho GRI averaged $10.67 per cwt during the 2010-11 marketing year. Strong prices encouraged expansion. In 2011, U.S. growers planted 67,700 more acres to potatoes than they did the previous year, a 7.4% increase. The national average yield was unchanged from the previous year, at 413 cwt per acre. The 2011 U.S. potato crop totaled 401.4 million cwt. That exceeded 2010 production by 27.4 million cwt, or 7.3%. Lower prices followed the production increase. The 2011-12 marketing year average Idaho GRI dropped to $7.89 per cwt, down 26% from the previous year.
A 4.5% Increase in 1996
At 405.7 million cwt, the 1995 potato crop fell 24.6 million cwt, or 5.7%, short of year-earlier production. The Idaho GRI averaged $7.87 per cwt during the 1995-96 marketing year. Growers planted 54,900 more acres to potatoes in 1996, a 4.5% increase. In addition, the U.S. average yield jumped to 361 cwt per acre from 334 cwt in 1995. The acreage and yield increases boosted the 1996 potato crop to 456.6 million cwt. That exceeded year-earlier production by 50.9 million cwt, or 12.5%. The Idaho GRI dropped to an average of $2.56 per cwt during the 1996-97 marketing year, down 67.5% from the previous year.
Conclusion
In 2014, 2011 and 1996, growers increased acreage following large downturns in production. They responded by planting 0.9% to 7.4% more ground to potatoes. If U.S. growers respond similarly to the current market situation, they may increase acreage for the 2025 crop by anywhere from 8,000 to 69,000 acres. If the U.S. yield returns to trend (461 cwt per acre), which is statistically most likely to occur, that could lead to a 13.6 million cwt, or 3.3%, increase in production if the planted area only increases by 8,000 acres. On the other hand, if growers plant 69,000 more acres to potatoes in 2025, at trend yield, total production would jump to 459.6 million cwt. That would result in a 10% increase in potato production, which would be slightly larger than the increase from the 2022 crop to the 2023 crop. An increase of that magnitude is unlikely, given current prices and expected contract reductions. However, growers might choose to increase the 2025 planted area (that has occurred in 15 of the 17 past similar situations). Trend yields combined with any increase in acreage would likely push prices even lower than current levels.
Planting decisions for the upcoming crop year are extremely complex. The current situation is different than past production downturns. Open-market potato prices have not followed the typical pattern this year. They have been relatively flat during the past three months. They remain below break-even for most producers. Alternative crop prices also could be a major factor affecting potato acreage this year. Prices for rotational crops are down 13%-24% from a year ago. The current market may discourage growers from planting open-market potatoes. In addition, contract volumes for the 2025 crop could be trimmed substantially. However, if history repeats itself, there is only an 11.8% chance that growers will reduce acreage in 2025.