|
Click to listen to this article
|
By Ben Eborn, Publisher, North American Potato Market News

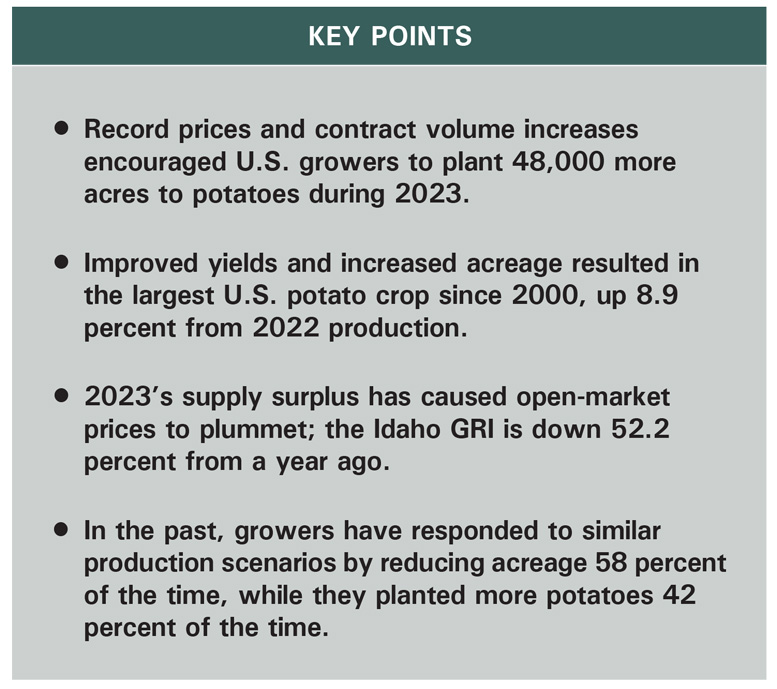
Growers have several things to consider when making planting decisions on 2024 potato acreage. Some of the factors include contract volumes, current and projected prices, production costs, prices for alternative crops, crop rotation and irrigation water supplies. Growers also might want to consider past scenarios. Before 2023’s estimated 8.9 percent year-over-year production increase, U.S. potato production had increased by 8 percent, or more, 17 times during the 74 years since 1950. Ten of those 17 years were followed by a downturn in the total U.S. planted area. The percentage reduction ranged from 0.3 percent to 11.3 percent, with a median drop of 7.1 percent. On the other hand, growers planted more ground to potatoes during the other seven years. The percentage increase ranged from 0.8 percent to 17.2 percent, with a median expansion of 3.8 percent. Past years with similar production patterns may provide some insight into 2024 planting decisions. In this article, we review the situation and explore three historical scenarios that followed similar production increases.
The Current Situation
The production increase of 2023 followed a four-year (2019-2022) downturn. U.S. production dropped by 7.7 percent from 2018 to 2022, even though acreage only fell by 4.6 percent during that period. Though the year-to-year slide was gradual, the overall decline was substantial. It supported record prices during the past two years. In response to strong prices and contract volume increases, U.S. growers planted 48,000 more acres to potatoes during 2023. Most of the growth came in Idaho, where growers increased their planted area by 35,000 acres. However, several other states also contributed to the expansion. Colorado, Michigan, Nebraska, North Dakota, Oregon and Wisconsin each planted approximately 2,000 acres more to potatoes in 2023. Maine and Florida planted 1,000 more acres. In addition to the acreage increase, the national average yield jumped to 452 cwt per acre, from 438 cwt per acre in 2022. The acreage and yield combination resulted in a 434.2 million cwt potato crop (according to USDA’s November estimate), up 8.9 percent from 2022 production. It is the largest U.S. potato crop since 2000. The supply surplus has caused prices to plummet. The Grower Returns Index (GRI) for Idaho russets (as of press time) has averaged $9.95 per cwt, down from $20.80 per cwt a year ago.
2001: Reduced Planted Area by 10.6 Percent
U.S. potato production increased by 8.5 percent in 2000. That exceeded the 1999 potato crop by 37.2 million cwt. The Idaho GRI averaged $2.67 per cwt for the 2000-01 marketing year. In 2001, growers cut their planted area by 131,300 acres, or 10.6 percent, in response to the below-breakeven prices. The 2001 crop totaled 401.9 million cwt, down 15.3 percent relative to the previous year. The large reduction was partially due to lower yields in nearly all the major growing areas. It was the smallest potato crop since 1993. The steep drop in production caused prices to skyrocket. The Idaho GRI averaged $8.66 per cwt during the 2001-02 marketing year, up 224.3 percent from a year earlier.
However, the cycle was quickly repeated in 2002; strong prices once again encouraged U.S. growers to expand acreage by 52,500 acres. Production for the 2002 crop climbed by 5.8 percent, to 425.4 million cwt. The Idaho GRI dropped to $4.84 per cwt during the 2002-03 marketing year, a 44.1 percent decline.
1995: Reduced Planted Area by 1.5 Percent
U.S. production jumped by 9.6 percent in 1994 to 430.3 million cwt. That exceeded the 1993 crop by 37.8 million cwt. The Idaho GRI averaged $4.55 per cwt during the 1994-95 marketing year. In 1995, U.S. growers planted 18,600 fewer acres to potatoes than they did the previous year, a 1.5 percent reduction. In addition to the minimal acreage reduction, the national average yield fell by 5.1 percent to 334 cwt per acre. The 1995 U.S. potato crop totaled 405.7 million cwt. That fell 24.6 million cwt, or 5.7 percent, short of year-earlier production. Stronger prices came as a result of the production downturn. The 1995-96 marketing year average Idaho GRI climbed to $7.85 per cwt, up 72.5 percent from the previous year.
1991: Increased Planted Area by 1.3 Percent
In contrast to the 2001 and 1995 scenarios, U.S. growers expanded potato acreage in 1991. At 358.3 million cwt, the 1990 potato crop exceeded year-earlier production by 27.2 million cwt, or 8.2 percent. The Idaho GRI averaged $5.51 per cwt during the 1990-91 marketing year. Growers planted 15,900 more acres to potatoes in 1991, a 1.3 percent increase. However, the U.S. average yield jumped to 317 cwt per acre, from 301 cwt in 1990. The acreage and yield increases boosted the 1991 potato crop to 378.9 million cwt. That exceeded year-earlier production by 20.5 million cwt, or 5.7 percent. The Idaho GRI fell to an average of $3.62 per cwt during the 1991-92 marketing year, down 34.3 percent from the previous year.
Conclusion
In 2001 and 1995, growers reduced acreage following large production increases. They responded by planting 1.5 percent to 10.6 percent less ground to potatoes. If U.S. potato growers respond similarly to the current market situation, they may reduce acreage for the 2024 crop by 15,000 to 102,000 acres. If the U.S. yield returns to trend (460 cwt per acre), which is statistically most likely to occur, that could still lead to a 2.3 million cwt increase in production if the planted area is only reduced by 15,000 acres. On the other hand, if growers planted 102,000 fewer acres to potatoes in 2024, at trend yield, total production would fall to 396.5 million cwt. That would result in an 8.7 percent downturn in potato production, which would be the largest reduction since 2001. A drop of that magnitude is unlikely and probably not necessary to support stronger prices.
On the other hand, growers might choose to follow the 1991 scenario and increase the 2024 planted area (that has occurred in seven of the 17 past similar situations). Trend yields and increased acreage would likely push prices well below current levels.
Planting decisions for the upcoming crop year could be complex. The current situation appears to be similar to past production expansions. Open-market potato prices have struggled to find a bottom so far this year. They are below breakeven levels for many producers. The current market may discourage growers from planting open-market potatoes. In addition, contract volumes for the 2024 crop could be trimmed substantially. However, if history repeats itself, there is only a 59 percent chance that growers will reduce acreage in 2024.

